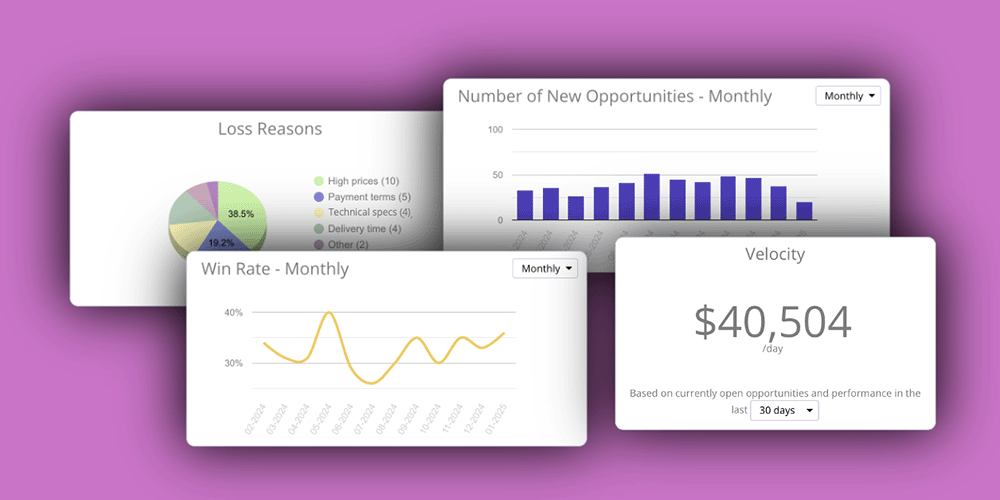
Here are the new features introduced this week:
Filters Are Now Even More Powerful
The filters at the top of the page let you customize the dashboard to suit your needs. They are now even more effective:
- Hierarchical Consolidation: When filtering the dashboard by opportunity owners, you can now include all departments under that person. For example, select a regional manager in the filter and check the “Include departments below” option to view the consolidated sales data for all users in that region.
- Date Range Filter: The date filter now affects only metrics related to closed opportunities, so we moved it to the top of that specific section for better usability.

Updates for Open Opportunities
Significant improvements have been made to the section providing detailed insights into ongoing opportunities:
- Trend Charts: Track the changes over time in the total value of open opportunities and the number of newly opened opportunities. View trends in monthly, weekly, or daily intervals, and click on any data point to access detailed lists of relevant opportunities.
- Sales Velocity Metric: This new indicator calculates how much you can sell on average in a day, based on your open opportunities and recent sales performance.
- Stuck Opportunities Indicator: It’s now easier to identify opportunities progressing slower than expected. Define custom stuck thresholds for each stage of your sales process, and view the number of opportunities exceeding these thresholds. Click on the indicator to list these opportunities.

Detailed Analysis for Closed Opportunities
This section provides tools to evaluate the performance of your closed opportunities:
- Charts for Won Opportunities: Analyze trends in sales revenue, the number of won opportunities, and win rates over monthly, weekly, or daily periods. Click on any data point in the charts to view detailed lists.
- Pie Chart for Loss Reasons: We’ve improved the pie chart showing reasons for lost opportunities. The reasons are now sorted from most to least frequent, making it easier to identify the factors that contribute most to lost sales.

Take Control of Your Sales Process
The key to sales success is clear visibility and effective management. TeamGram CRM’s new sales dashboard is designed to provide this clarity. With these updates, you can make data-driven decisions, detect issues early, and improve your win rates.
To access the new sales dashboard:
Click the Dashboard option under the Sales Opportunities section in the main menu.
Explore it now and elevate your sales performance to the next level!
