TeamGram’s instant metrics help you grasp essential data about your sales at a glance. That’s great, but your sales team may need more than that.
Currency exchange rates. The latest raw material prices. Expected lead times for new orders… Wouldn’t it be great if your CRM could display these too?
No more manual spreadsheet lookups
You probably keep track of these and a lot of other valuable data in spreadsheets. But why share an entire spreadsheet with your team when all they need is a number or a simple chart?
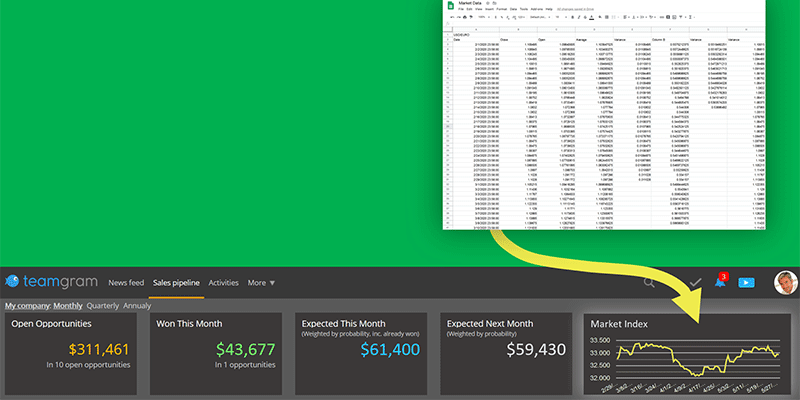
Now you can create custom TeamGram dashboard widgets that display data pulled from Excel and Google Sheets. You can even configure them to display graphs and auto-update periodically.
They are secure, too: You can share the widgets with your team without sharing the spreadsheet providing the source data. You can even tell TeamGram to display your widgets only to specific users or departments.
Custom widgets can be placed on your sales pipeline page or in your dashboards.
Available Widget Types
We are launching custom widgets with several different styles:
Bar Graph: Use bar graph widgets to display comparative values of different variables side by side.
Time-Series Line Chart: These are great to show how a numerical value changes over time.
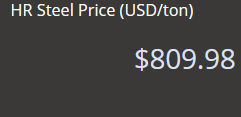
Single Value: These are great to pull a single numerical or text value from a spreadsheet and display it on your dashboard.
List: These are similar to single value widgets but display multiple values in a small table.
Works with Microsoft Excel and Google Sheets
TeamGram widgets can pull data from your Excel files on Microsoft OneDrive or Google Drive. If your source file is on a local drive, make sure you move it into a folder synchronized to OneDrive or Google Drive first.
Google Sheets are always on the cloud, so you don’t need to move them to make them accessible to TeamGram.
Getting Data from Other Apps
Use this feature to pull data from anywhere. Your ERP software can probably export Excel files. Google Sheets has financial functions that provide currency, stock, and commodity prices. Zapier can parse your emails to fill in data into spreadsheets. The possibilities to display live business data in TeamGram are limitless.
Creating Widgets:
Only users with administrator-level access can create and share custom widgets.
To create a custom widget, first make sure you have your data in OneDrive or Google Drive in an Excel file or in Google Sheets.
You will also need to authorize TeamGram to access your cloud storage. To do this, go to Control Panel > Integrations > User integration > Other. You will need to authorize access to each cloud storage service only once.
Then go to Control Panel > Custom Widgets and click on create new widget.
Not a TeamGram user yet? Sign up for a free trial now.
